Published 2022-02-21.
Last modified 2025-07-13.
Time to read: 6 minutes.
jekyll collection.
This article is the last in a three-part series.
The first article
describes how to install and use the jekyll_bootstrap5_tabs plugin.
The second article describes how the Jekyll plugin was constructed.
The plugin is built and published as an open-source Ruby gem.
This article is dedicated to demonstrating a straightforward way of debugging Jekyll plugins,
which are always written in Ruby.
Many open-source projects fall far short of their true potential because no-one bothers to tell the story, completely and thoughtfully, in depth. Hopefully this article will in some small way improve Jekyll’s circumstance in the F/OSS world.
The Jekyll documentation provides absolutely no commentary on how to debug plugins. Perhaps the Jekyll developers felt the information would be obvious to sufficiently experienced programmers. Because so many debugging possibilities exist, most of which recently became obsolete, I did not find it obvious. Hopefully this article will clear things up.
Prerequisites
The Setting Up a Ruby Development Environment and Essential Visual Studio Code Extensions for Ruby articles describe the necessary preparations.
These Instructions Work Everywhere
The instructions in this article should work on every OS that Jekyll runs on.
Many problems with debugging Jekyll plugins are related to the plugin’s need to receive parameters from Jekyll. We do not need to dig into Jekyll itself to get this sorted out; all we need to do is to find where the gem you want to debug was installed, and set breakpoints after it receives parameters. The information that the IDE will then present to you will far exceed what the Jekyll plugin documentation provides.
Plugins Run In the Jekyll Address Space
The most important thing to know about debugging Jekyll plugins is that they run in the same address space as Jekyll itself. That means to debug a plugin you must actually debug the Jekyll process, and it will load the most recently created version of your plugin.
If you set a breakpoint on the installed plugin's source code, execution will halt when the plugin is loaded or invoked. You will be able to see the call stack and the variables at each level of the call stack. This is super helpful!
Orientation
For the purposes of this article, I assume that you have a Jekyll plugin that you want to debug.
It does not matter if you wrote the plugin or not.
All that matters is that the plugin was installed.
Throughout this article, I will refer to this gem as “the subject gem”.
I wrote this article to figure out how to debug my subject gem, which is
jekyll_bootstrap5_tabs,
so you will see references to that gem in this article whenever I discuss what needs to be done with your subject gem.
Move to your Jekyll project directory, this is where we will work. For me, that meant:
$ cd $jekyll_bootstrap5_tabs
If you are curious where the environment variable above was defined, when my Bash shells start, they source $work/.evars.
The following lines are within:
export work=/var/work
export jekyll=$work/jekyll
export jekyll_flexible_include_plugin=$jekyll/jekyll-flexible-include-plugin
export jekyll_bootstrap5_tabs=$jekyll/jekyll_bootstrap5_tabs
export jekyll_template=$sites/jekyll_template
That is part of a directory structure I maintain across several machines.
Jekyll Launcher
Jekyll is provided as a Ruby gem.
When the Jekyll gem is installed, it also creates a launcher,
which is actually a small Ruby program that loads the gem.
If Ruby is installed without virtualization, the launcher path is /usr/;
otherwise, if rbenv is used,
the launcher path is $HOME/.
#!/usr/bin/env bash
set -e
[ -n "$RBENV_DEBUG" ] && set -x

program="${0##*/}"
if [ "$program" = "ruby" ]; then
  for arg; do
    case "$arg" in
    -e* | -- ) break ;;
    */* )
      if [ -f "$arg" ]; then
        export RBENV_DIR="${arg%/*}"
        break
      fi
      ;;
    esac
  done
fi

export RBENV_ROOT="/home/mslinn/.rbenv"
exec "/usr/lib/rbenv/libexec/rbenv" exec "$program" "$@"
Jekyll is best debugged when launched via the normal means, that is, via the launcher path as shown above. The launcher figures out where the Jekyll gem resides, and loads it.
Locating the Subject Gem
Debugging an installed gem requires that the gem be located before it can be debugged. If your Jekyll website uses a Gem that you need to debug you can point to the Gem source code instead of using the installed Gem.
Debugging A Gem From A Git Repository
Dependencies listed in a Gemfile can have options.
Two commonly used options are: version syntax and path.
-
Version syntax For example:
Gemfile
source 'https://rubygems.org' gem 'jekyll', '>= 4.4.1' -
pathoption to the Gem source code. If you define an environment variable that points to the top of each of your Git directory trees, you can use the value of an envonment variable in a Gemfile. For example, in my main workstation, the environment variable calledjekyll_outlinepoints to/mnt/. The following example obtains the value of the environment variable calledf/ work/ jekyll/ my_plugins/ jekyll_outline/ jekyll_outlineand uses it to specify the location of the dependency. Any version syntax specified is ignored if thepathoption is specified.Gemfilesource 'https://rubygems.org' jekyll_outline = ENV.fetch('jekyll_outline', nil) group :jekyll_plugins do gem 'jekyll', '>= 4.4.1' gem 'jekyll_outline', '>=1.3.0', path: jekyll_outline end
The above entry forjekyll_outlinecould also have been written as:Gemfile fragmentgem 'jekyll_outline', path: jekyll_outline
Debugging an Installed Gem
You need to know where the subject gem was installed to set breakpoints in it. From within a Jekyll project that uses the subject gem, discover the location of the Jekyll entry points within the gem as follows:
$ bundle info jekyll_flexible_include
  * jekyll_flexible_include (2.0.22)
        Summary: Jekyll plugin supports various ways to include content into the generated site.
        Homepage: https://www.mslinn.com/jekyll_plugins/jekyll_flexible_include.html
        Source Code: https://github.com/mslinn/jekyll_flexible_include_plugin
        Changelog: https://github.com/mslinn/jekyll_flexible_include_plugin/CHANGELOG.md
        Bug Tracker: https://github.com/mslinn/jekyll_flexible_include_plugin/issues
        Path: /home/mslinn/.rbenv/versions/3.1.2/lib/ruby/gems/3.1.0/gems/jekyll_flexible_include-2.0.22
The jekyll_flexible_include gem is located at
/.
Now we need to find the entry point for the plugin,
which is where Jekyll invokes the functionality of the plugin.
If we search for render_impl we'll find the source files containing the top-level logic of a Jekyll Plugin Support gem.
$ grep -rl render_impl \
/home/mslinn/.rbenv/versions/3.1.2/lib/ruby/gems/3.1.0/gems/jekyll_flexible_include-2.0.22/*
/home/mslinn/.rbenv/versions/3.1.2/lib/ruby/gems/3.1.0/gems/jekyll_flexible_include-2.0.22/lib/flexible_include.rb
Now we know we need to open
/
in Visual Studio to set breakpoints.
Here is a one-line command that will tell you that same information:
$ grep -rl render_impl \
  "$( bundle info jekyll_flexible_include | \
    grep Path | \
    awk '{print $2}' )"
/home/mslinn/.rbenv/versions/3.1.2/lib/ruby/gems/3.1.0/gems/jekyll_flexible_include-2.0.22/lib/flexible_include.rb
locate_gem Script
Here is a Bash script that can be used for this purpose:
#!/bin/bash

function help {
  if [ "$1" ]; then echo "$1"; fi
  echo "
$(basename "$0") - returns the absolute path of the file in an installed gem that contains a string.

Example usage:
  $ $(basename "$0") jekyll_flexible_include render_impl
  /home/mslinn/.rbenv/versions/3.1.2/lib/ruby/gems/3.1.0/gems/jekyll_flexible_include-2.0.22/lib/flexible_include.rb

This Bash script is meant to be executed from the top-level directory of a Ruby project.
"
  exit
}

if [ ! -f Gemfile ]; then
  echo "Error: $(basename "$0") is meant to be executed from the top-level directory of a Ruby project."
  exit 2
fi

if [ "$#" != 2 ]; then help ""; fi

GEM_NAME="$1"
TEXT="$2"

INFO="$( bundle info "$GEM_NAME" )"
if [ "$INFO" == 'Could not locate Gemfile' ]; then
  echo "$GEM_NAME is not referenced by this Ruby project"
  exit 1
fi

grep -rl "$TEXT" \
  "$( echo "$INFO" | \
    grep Path | \
    awk '{print $2}' )"
This is the help message for the script:
$ locate_gem
locate_gem - returns the absolute path of the file in an installed gem that contains a string.

Example usage:
  $ locate_gem jekyll_flexible_include render_impl
  /home/mslinn/.rbenv/versions/3.1.2/lib/ruby/gems/3.1.0/gems/jekyll_flexible_include-2.0.22/lib/flexible_include.rb

This Bash script is meant to be executed from the top-level directory of a Ruby project.
This is the script in action:
$ locate_gem jekyll_flexible_include render_impl
/home/mslinn/.rbenv/versions/3.1.2/lib/ruby/gems/3.1.0/gems/jekyll_flexible_include-2.0.22/lib/flexible_include.rb
Setup Debugging
Now it is time to launch Jekyll under control of rdbg.
You can specify all the normal Jekyll options for local usage, as shown below. They might impact the responsiveness of the debug session, but are workable nonetheless.
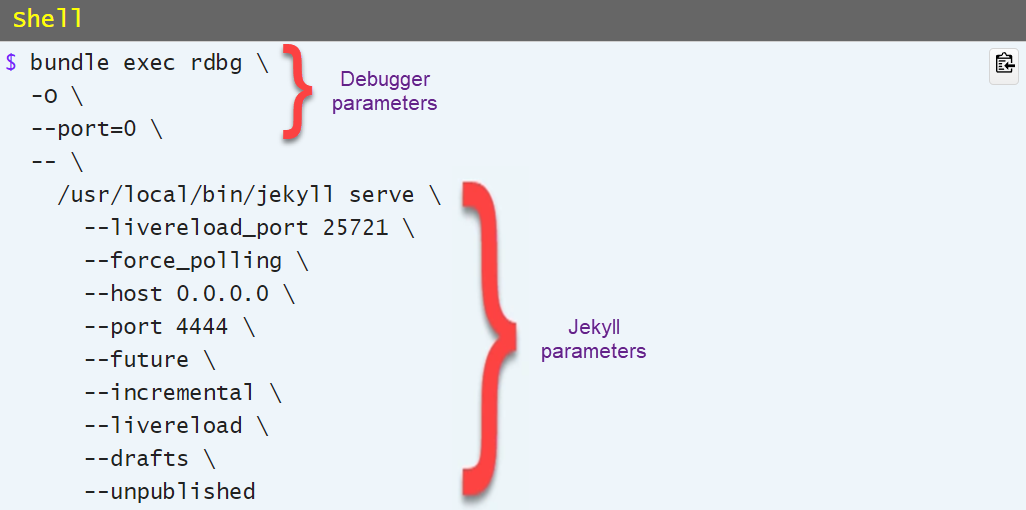
$ bundle exec rdbg \
  -O \
  --port=0 \
  -- \
    /usr/local/bin/jekyll serve \
      --livereload_port 25721 \
      --force_polling \
      --host 0.0.0.0 \
      --port 4444 \
      --future \
      --incremental \
      --livereload \
      --drafts \
      --unpublished
DEBUGGER: Debugger can attach via TCP/IP (127.0.0.1:46229)
DEBUGGER: wait for debugger connection...
Jekyll does not run any slower under the Ruby debugger.
Above you see 2-stage launches expressed as single command lines. The backslashes are line continuation characters, which is why 'one command line' actually spans a dozen or so lines.
- Stage 1: debugger parameters
- Stage 2: Jekyll parameters
I took a screen shot of the above command line and added a few comments:
I made the following run configuration for Visual Studio Code to launch a debug process.
Note that this is not the entire contents of .vscode/launch.json, just the one run configuration.
{
  "args": [
    "serve",
    "--livereload_port", "35732",
    "--force_polling",
    "--host", "0.0.0.0",
    "--port", "4444",
    "--future",
    "--incremental",
    "--livereload",
    "--drafts",
    "--unpublished"
  ],
  "cwd": "${workspaceRoot}/demo",
  "debugPort": "0",
  "name": "Debug Demo",
  "request": "launch",
  "script": "${workspaceRoot}/binstub/jekyll",
  "type": "rdbg",
  "useBundler": true,
},
The steps to establish a debugging session are listed below. If you would like to try this out on a project that is already setup for this, download the jekyll_plugin_support project.
- Set a breakpoint in Visual Studio Code (I will discuss this next).
- Attach the Visual Studio debug client using the run configuration called
Debug Demo.
Breakpoint Types
Visual Studio Code supports several types of breakpoints. This article discusses only two types: location-based breakpoints and function breakpoints. The Microsoft documentation explain how breakpoints work in detail; I won't repeat that information here.
The overhead of breakpoints can be reduced.
Execution Break - Ta-Da!
When VS Code hits a breakpoint, the call stack and variables are shown, and the editor displays the line that the debugger stopped at.

Now for the ta-da! moment. If you are not a programmer, this will go over with a thud. Since you made it this far, you are either a masochist, or a programmer.
Take a good long look at the variables in the following screenshot. You can see what has been passed from Jekyll to the plugin easily here. This information is really hard to come by any other way.
Context.@environments
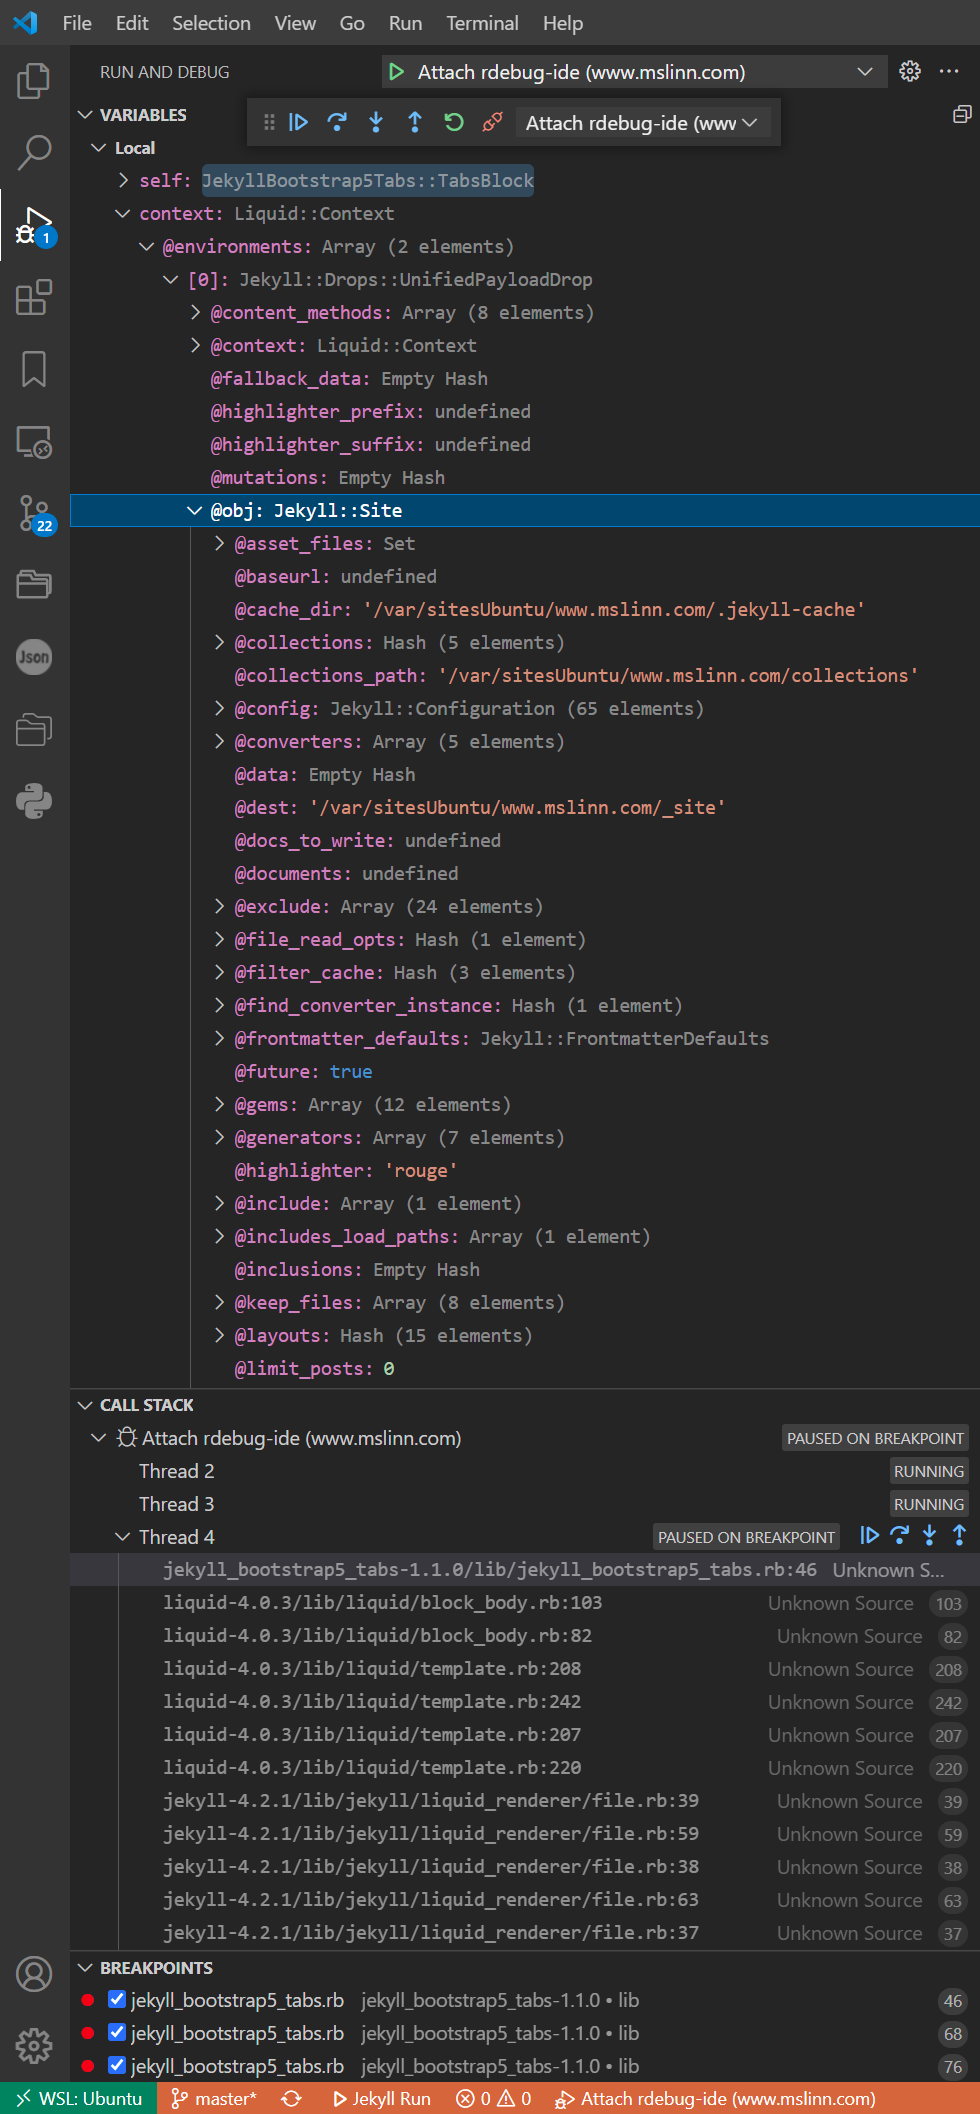
context.instance_variable_get('@scopes'), an array of hashes, has only one entry: 'nowMillis': '1645386226'.
That was a Liquid variable that I had set in the page that contained a reference to the Bootstrap 5 tabs plugin.
self
The debugger paused at the start of TabsBlock#render.
The variable self has type JeklyyBootstrap5Tabs::TabsBlock,
and it looks like this:
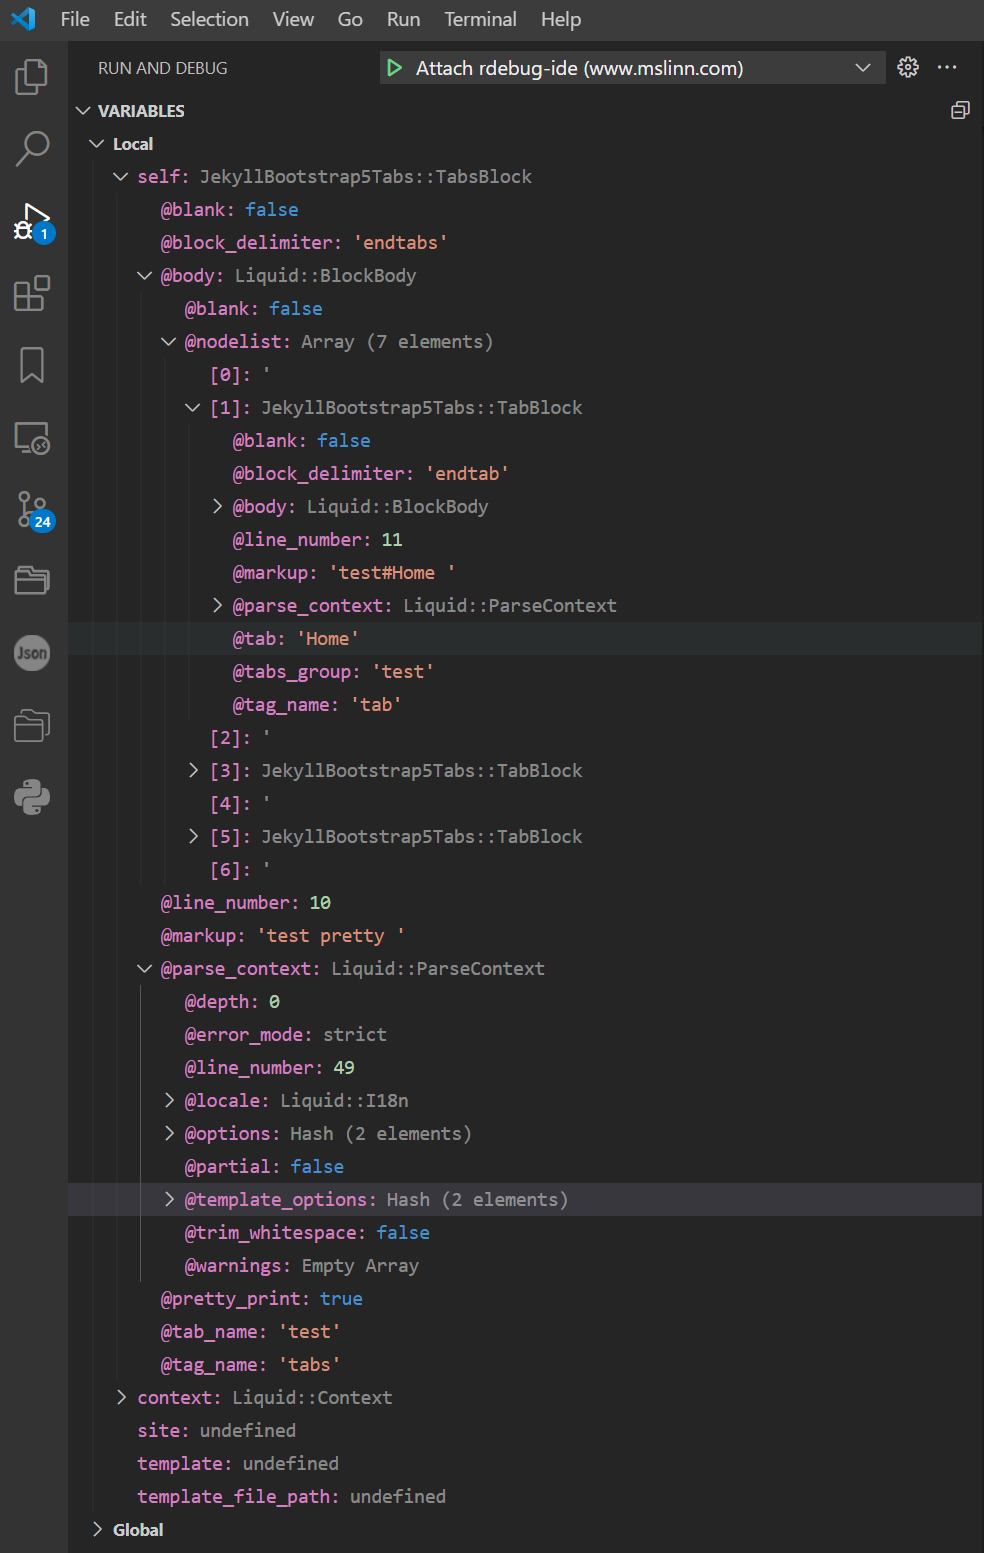
The Jekyll tag was: {% tabs test pretty %}:
self.@markupis a string with valuetest pretty(with a space at the end).self.@pretty_printistrue.self.@tab_nameis a string with valuetest.self.tag_nameis a string with valuetabs.
To Learn More
For more about creating Jekyll plugins, please see the The jekyll_plugin_support project.
About the Author

I, Mike Slinn, have been working with Ruby for a long time now. Back in 2005, I was the product marketing manager at CodeGear (the company was formerly known as Borland) for their 3rd Rail IDE. 3rd Rail supported Ruby and Ruby on Rails at launch.
In 2006, I co-chaired the Silicon Valley Ruby Conference on behalf of the SD Forum in Silicon Valley. As you can see, I have the t-shirt. I was the sole chairman of the 2007 Silicon Valley Ruby Conference.
Several court cases have come my way over the years in my capacity as a software expert witness. The court cases featured questions about IP misappropriation for Ruby on Rails programs. You can read about my experience as a software expert if that interests you.
I currently enjoy writing Jekyll plugins in Ruby for this website and others, as well as Ruby utilities.


